Enter now for your chance to win a 3 month Nanoimager subscription to study your EVs Enter here
EV Profiler 2 with AutoEV
From sample to answer

Key features
Streamlined
The first end-to-end EV workflow for super-resolution combining a kit, data acquisition and robust EV-specific analysis and reporting
Flexible
Choose from multiple EV capture options, label for surface or cargo, and easily assay for your biomarkers of interest in one kit
User-friendly
Simplified and user-friendly imaging setup, making data capture and analysis accessible to all levels of expertise
Automated
Prepare samples faster with our optimized protocol; acquire and analyze an entire 4-lane chip in 90 mins with AutoEV
Optimized
Capture more EVs with our optimized surface and protocol and gain new insights with Pan-EV and cargo labeling tools
Application Kit™: EV Profiler 2
From sample to answer
EV Profiler 2* is our second generation reagent kit for visualization and phenotyping of extracellular vesicles using dSTORM microscopy on the Aplo Scope and Nanoimager**.
The new kit introduces our Pan-EV stain, internal cargo detection as well as major improvements to reproducibility and EV capture efficiency. Capture stunning super-resolution images of EVs labeled with Pan-EV and Tetraspanin Trio for high confidence EV identification and sizing (with accuracy comparable to TEM), while using the only tool on the market that can characterize the spatial distribution and colocalise up to three biomarkers at the individual EV level.
When combined with our newest software offering, AutoEV, your system will be calibrated and optimized to acquire and analyze a 4-lane chip automatically and deliver a comprehensive report of EV size and positivity for each individual lane in 90 mins.
Need help choosing? Try our EV Profiler 2 product selection tool!


What’s in the kit?
- 3 Assay Chips, each with four lanes
- Surface Reagent
- A selection of capture antibodies to choose from
- Pan-EV Detection and Tetraspanin Trio
- Fixative, Wash Buffer and Staining Buffer
- Permeabilization Buffer
- dSTORM Imaging Buffer
Optional add ons
- 3 Color Tetraspanin Antibody Panel (CD9, CD63 and CD81)
- HEK EV Standard Control (EVs from HEK culture media)
*EV Profiler 2 has a shelf life of two months.
**AutoEV requires a CODI account and an active internet connection. Access to AutoEV without an internet connection will come later. EV Profiler Kit 2 and AutoEV are compatible with and Aplo Scope or Nanoimagers manufactured from 2021 on.
EV characterization and biomarker visualization redefined
Confidently identify your EVs

Be confident your EVs are really EVs
EV Profiler 2 includes ONI’s Pan-EV Detection and pooled Tetraspanin Trio reagents. This combination ensures the exclusion of contaminating particles or antibody aggregates from the analysis.
Key outputs:
- Identification of true EVs through the utilization of ONI’s Pan-EV Detection reagent
- Tetraspanin Trio Detection reagents ensures precise analysis, excluding contaminating particles and antibody aggregates
- EV Profiler 2’s advanced features support the 2023 MISEV guidelines enabling orthogonal characterization of EV samples with a robust and reliable EV analysis workflow
Visualize & size like TEM

Visualize and size your EVs accurately, quickly and easily
Quick and unbiased visualization and sizing of EVs through the pan-EV stain, reveals both membrane and shape details for a comprehensive analysis of their dimensions and characteristics.
Key outputs:
- Visualization of EVs providing a clear and detailed view of the EV membranes with sizing comparable to TEM, but faster and from your labs benchtop
- The pan-EV stain labels EV membranes, ensuring unbiased sizing for accurate dimension information
- Unveil the shape of EVs, and have a more comprehensive understanding of their characteristics
Profile surface & cargo markers

Detect and visualize biomarkers inside or on the surface of EVs
Detect and visualize biomarkers inside and on the surface of EVs, allowing for efficient phenotyping and insight into biomarker clustering.
Key outputs:
- Label samples in stunning 3-color super-resolution and assay for cargo or surface biomarkers all in one kit
- Reveal the clustering of biomarkers on or within EVs, offering a more detailed understanding of their distribution
Co-localize up to 3 channels

Co-localize up to three biomarkers
EV Profiler 2 detects biomarkers in up to three channels, enabling measurement of single, double, and triple positivity on individual EVs with a 10% SD between assay chips.
Key outputs:
- Assay for size and positivity by combining Pan-EV, Pooled Tetraspanin Trio, and a biomarker of your interest or analyze each independent Tetraspanin in its own channel
- A validated antibody panel including anti-CD9 (488), anti-CD63 (561) and anti-CD81 (647) can be purchased as an add on
- Biomarker positivity across multiple chips and lanes (left) falls below 10% standard deviation when measuring single, double, and triple positivity for CD9, CD63, and CD81
Ready to purchase?
AutoEV™: EV acquisition, analysis, and reporting software
Experiment setup

Experiment setup
The software has default settings tailored for each variant of the kit. All you need to do is inform the software about your specific reagents, and it will automatically adjust the acquisition settings accordingly. Additionally, users have the flexibility to select and apply specific analysis settings after the imaging process, providing a flexible and efficient experience.
One-click channel mapping

One-click channel mapping
Channel mapping is a simple, one-click step!
One-click system calibration
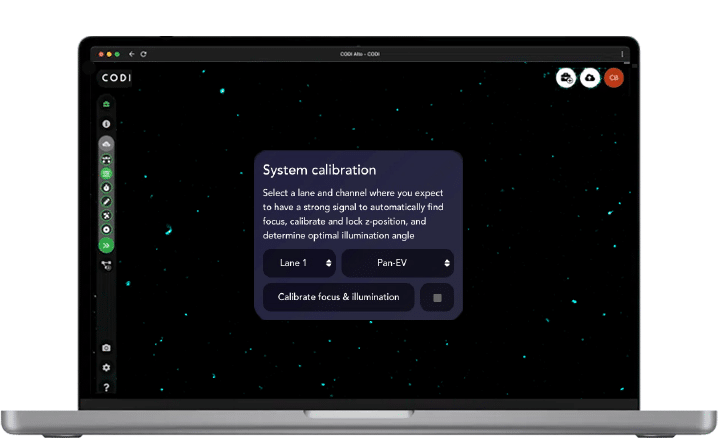
One-click system calibration
The system is designed for automatic calibration processes, aimed to enhance data consistency and reproducibility across lanes and chips. These processes include autofocus, automatic-Z-lock, and auto-TIRF, all of which contribute to optimized system performance. The system considers the specific properties of the analyzed sample and automatically determines the appropriate settings. The user simply selects a specific lane and imaging channel where they expect a robust signal for the system calibration, streamlining the overall imaging experience, however, the system also allows for manual settings if the user prefers.
Sample check
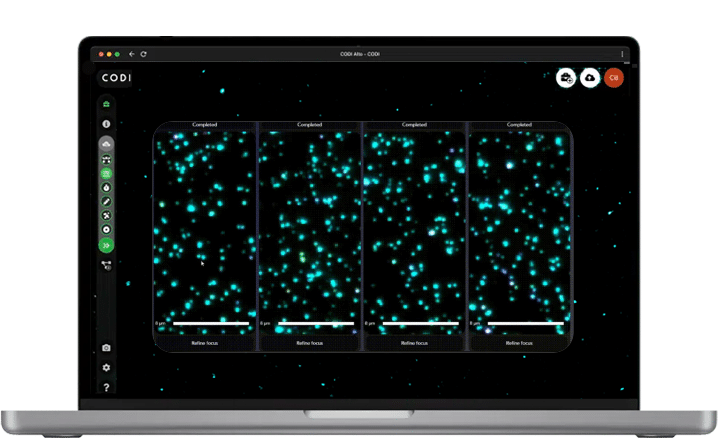
Sample check
The system facilitates a rapid assessment of key features within minutes including the density of EVs in the sample, their distribution and the efficacy of biomarker staining. This step ensures the quality and the reliability of the sample before the full imaging process. If necessary, users have the option to modify the autofocus settings on a per-lane basis, based on the insights they gained from the images. This adaptive approach allows for fine-tuning and optimization in real-time, ultimately contributing to the accuracy and the precision of the imaging results.
Automatic 4-lane acquisition

Automatic 4-lane acquisition
Users have to flexibility to choose their preferred fields of view (FOV) for imaging or opt for the FOVs recommended by our expert development scientists. The process is streamlined to efficiently and automatically image a 4-lane chip within 90 minutes. Users can access information about the EV count within minutes, thanks to the system’s real-time analysis capabilities. This features provides users with immediate insights, enhancing the overall efficiency and and responsiveness of the imaging workflow.
Summary page & EV mosaic

Summary page & EV mosaic
Upon completion of the 4-lane acquisition, a mosaic summary view offers a visual representation of the biomarker heterogeneity at the single EV level. This feature enables users to swiftly navigate through different EVs of the same positivity class by clicking on next/previous options. Positioned at the bottom of each lane, this mosaic view facilitates a convenient visual comparison of EVs across various conditions. The immediate insights gained from this overview aid in determining the success of the acquisition process.
Custom 1-page EV report

Custom 1-page EV report
By selecting “Generate Report”, the user can quickly generate a concise 1-page report, featuring three essential, easily comparable metrics. This report provides valuable insight on the quality of your sample, including EV count, biomarker heterogeneity count, and EV size. The metrics are presented at both the population level and according to each biomarker positivity, offering a comprehensive overview of the sample characteristics for efficient analysis and decision-making.
Free analysis tool

EVP2 Axis
EVP2 Axis is a free, open-source app that enables easy analysis of extracellular vesicle (EV) data across multiple datasets and chips. Designed for use with CODI results files, it allows users to generate both standardized and custom plots with user-defined sample names, analyzing features like EV counts, biomarker positivity (e.g., Tetraspanins), and more for each field of view (FOV). The tool also supports advanced, population-level plots—such as scatter plots, histograms, and violin plots—of EV shape, size, and abundance, with customizable color schemes based on chip, FOV, or biomarkers. By analyzing multiple samples and chips simultaneously, EVP2 Axis offers deeper insights for EV data exploration.


FAQs
What species of EV can I use with EV Profiler 2?
The antibodies for capture and detection are specific to human and have not been tested for cross-reactivity with other species.
What EV purification method is recommended for EV Profiler 2?
To best reveal the structure of EVs we recommend using a gentle purification method for example size exclusion chromatography, tangential flow filtration or density gradient centrifugation. Ultracentrifugation and precipitation based purification are thought to result in aggregation and disruption of EVs.
Can I use AutoEV with my own slide?
AutoEV is built to automatically acquire field of view in the lanes of the EV Profiler 4-lane assay chip with a single click, and is not intended to be used with any other slides or coverslips.
Does AutoEV have manual controls as well?
AutoEV introduces great new algorithms like AutoFocus, AutoTIRF, and automated acquisition across lanes. You can manually set the illumination (TIRF) angle if desired, and you can adjust the focus on a per-lane basis prior to starting the automated acquisition, so you can be sure to have the imaging results you want, all while being able to step away from the microscope for imaging.