ONIs latest White Paper – Fast, high-throughput LNP sizing and characterization using an automated high-precision workflow read here>
Training Kit: dSTORM
Last updated: July 10th 2025

Sample preparation, image acquisition and analysis user guide
The ONI dSTORM Training Kit includes a microscopy slide with fixed and permeabilized mammalian cells, and reagents to label and image nuclear pores using the Nanoimager.
Advice before you start
Print Section
Guidance for using sample slide
Once the slide is opened it shouldnot be re-sealed or stored at -20ºC. Liquid should be added into each lane through the inlet hole marked “IN”, taking care not to introduce bubbles into the lane. Pipette out any air at the pipette tip before pipetting liquid into the inlets, and stop pipetting once all the liquid in the tip has been pushed out. The slide inlet is optimally designed to work with 200 μL pipette tips, using either a p20 or p200 pipette. It is not recommended to use other tip sizes.
- Place the slide on a clean surface. The slide pouch or a clean tissue can be used.
- In order to ensure consistent liquid delivery, insert the pipette tip into the inlet at a 90° angle, holding the pipette vertically.
- Before pushing contents out, press the pipette tip against the inlet walls until a resistance is felt to create a seal and keep light pressure while pipetting. Liquid should be seen flowing into the lane and coming out at the outlet side “OUT”of the slide lane. Add entire volumes gently in one motion, taking care not to move liquid back and forth within the lane.
- If any liquid is seen leaking from the inlet port, it means that the seal between the pipette tip and inlet port is not optimal. If this occurs, stop pipetting but do not reverse the flow of liquid by sucking back through the pipette. Gently adjust the position of the pipette to improve the seal around the pipette tip and then continue to push the remaining volume through the slide. It is safest to repeat the addition of liquid in that lane before proceeding if needed.
- It is recommended to use an aspirator connected to a vacuum or suction pump to remove excess solutions from the outlet port. This can be most easily achieved by placing the aspirator tips at the edge of the wide outlet reservoir and keeping in a fixed position as you pipette. Do not place the aspirator tip into the central hole of the slide outlet as this will result in aspiration of all liquid from the sample lane, which will impact sample quality.
- If an aspirator is not available, liquid waste can be removed from the slide outlet by gently touching the surface of the droplet forming around the outlets using a delicate task tissue (e.g. Kimwipe) to absorb excess liquid.
- While the reagents on the slide are incubating, cover the slide with the pouch provided or a box lid, so that the slide stays clean and covered from light.
- If any air pockets or very large bubbles are observed at any step inside the slide lanes, additional liquid can be flushed through the relevant lane to push this out before proceeding with the following steps in the protocol. This is not recommended unless required, as it risks damaging the slide surface. Avoiding introduction of air bubbles during slide handling is crucial for the success of the experiment.
It is recommended that you read the complete protocol thoroughly before starting. Kit materials only allow for 1 experimental cycle, with imaging buffer provided for up to 4 imaging sessions. Please pay particular attention to the sample slide guidance section below, as well as the reagent handling considerations (i.e. when reagents should be removed from storage, thawed, or warmed up).
Important reagent handling considerations
- Assay slides should be brought to room temperature before opening. Please note that once opened, slides cannot be stored or reused.
- BCubed B should be kept at -20ºC at all times and should only be removed briefly before adding to BCubed A, and kept on ice during handling. Then, immediately returned to -20ºC.
- Following first thawing, BCubed A may be aliquoted in 100 µL volumes and refrozen at -20ºC if desired. If doing this, it is recommended to thaw the original stock on ice to minimize exposure to higher temperatures. Once aliquoted, each aliquot should be used once only and not refrozen.
- The Staining Solution is photosensitive and should be protected from light when not being directly handled. This also applies to the Sample Slide during and following staining.
Suggested protocol stop points
- It is recommended to image the sample on the same day as preparation, however, it is also possible to store the sample for up to 7 days prior to imaging. Ensure that the slide inlet and outlet are well sealed and then place at 4ºC, protected from light.
- If planning to image the sample multiple times on different days, wash out the BCubed buffer after each imaging session with 150 µL Washing Solution or phosphate buffered saline prior to storing as described above.
Component list
Print Section
| Component | Quantity | Volume | Hazard | Storage |
|---|---|---|---|---|
| Sample Slide | 1 | – | N/A |
|
| Staining solution | 1 | 60 µL | N/A |
|
| Fixative | 1 | 340 µL |
|
|
| Washing solution | 1 | 1.5 mL | N/A |
|
| BCubed A | 1 | 400 µL |
|
|
| BCubed B | 1 | 25 µL | N/A |
|
✝ Single-use
Equipment needed
- Pipettes (p20 and p200)
- Pipette Tips
- Vials (1.5 mL microtubes)
- Timer
- Aspirator or Vacuum Pump (optional)
- Water bath or heat block
- Lens cleaning paper
- Objective oil
- Nanoimager
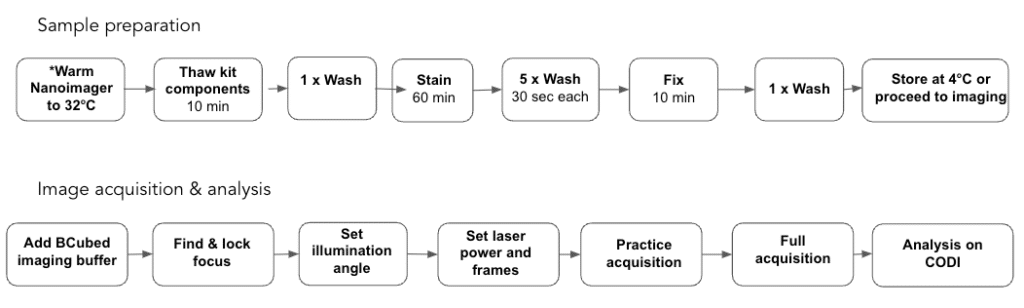
Experimental workflow overview
*If imaging on the same day as sample preparation

Stepwise protocol
Print Section
All steps are performed at room temperature. It is recommended to perform imaging as soon as is convenient after sample preparation. Refer to the Sample preparation training video for support: oni.bio/dstormtrainingkit_resources
Sample preparation – total time: 85 – 95 min
Important note: if imaging on the same day as sample preparation, begin warming the Nanoimager to 32ºC before beginning with step 1, for at least 60 minutes prior to imaging. Refer to the Sample Preparation training video for additional support:
- Remove the Staining Solution, Washing Solution, and Fixative from -20°C storage and allow to reach room temperature, while protected from light. Do not remove the BCubed buffer from the -20°C freezer at this stage.
- Thaw the Sample Slide unopened by allowing it to reach room temperature for 10 minutes. This is important to minimize bubble formation.
- Open the Sample Slide pouch and place the slide on a clean, flat surface. Take care during handling not to damage or deface the glass underside of the slide. Retain inlet/outlet sealing stickers provided.
- Gently flush 100 μL Washing Solution through the sample lane.
- Apply 50 µL Staining Solution and incubate for 60 minutes, protected from light.
- 30 minutes before the completion of the staining incubation, transfer the Fixative to 37°C water bath or heat block.
- Wash Sample Slide five times with 100 μL Washing Solution. Wait 30 seconds between each wash.
- Apply 50 µL warm Fixative and incubate for 10 minutes, protected from light.
- Wash once with 100 µL Washing Solution.
- EITHER proceed to step 11 for immediate imaging, OR seal lane with stickers provided and place at 4°C, protected from light for storage.
Image Acquisition – total time: 30-60 min
Before starting, ensure the Nanoimager is stable at 32ºC
- Remove BCubed A from -20°C storage and place at room temperature. Once thawed, transfer 99 µL BCubed A into a microcentrifuge tube.
- Take BCubed B from -20°C storage and place on ice immediately. Add 1 µL BCubed B to the 99 µL BCubed A and gently mix by pipetting.
Important note: do not shake or vortex the tube in order to minimize the introduction of oxygen into the solution. Keep BCubed on ice while handling, store immediately at -20°C after use.
- Apply 50 µL BCubed solution through the sample lane, first removing the lane-sealing sticker if applicable.
- Seal lane inlet and outlets using the sticker provided. The sample is now ready for imaging.
- Carefully clean the microscope objective lens with an appropriate ultrafine lens cleaning wipe dipped in 100% ethanol. Do not apply pressure to the objective itself and avoid any potentially abrasive contact with the lens.
Important note: do not use a Kimwipe on the objective lens of the Nanoimager, but ultrafine lens cleaning paper.
- Apply 1-2 drops of immersion oil onto the objective lens so it is well covered in oil (avoiding it spilling down the sides) and place the sample on the stage using the magnets provided with the Nanoimager, ensuring the lens is roughly central in the sample lane.
At this point, open the Image Acquisition & Analysis training video which will introduce you to the Nanoimager software (NimOS) and guide you through the acquisition and analysis.
The NimOS software is accessed from the desktop of the laptop connected to the Nanoimager.
Finding & locking focus
- In the Nanoimager software (NimOS), activate the 520 nm transillumination laser to 50% power and ensure the focus laser is active.
- Starting at 0 µm, move the stage Z position down by clicking inside the Z text field and using the arrow keys (hold Control + Down arrow key to increase speed of movement), until the highest contrast image is observed in the top right focus laser window and the slide surface comes into rough focus in transillumination. Note that there may or may not be cells present in the exact position initially imaged.
- Once you have found rough focus, turn off the transillumination and activate the 640 nm laser at 5% power and move the stage in X and Y directions, by clicking the camera image and using the arrow keys, to locate the cells of interest. Ensure the cells are in focus, run “set focus reference” calibration, then activate Z-lock to fix the focus.
Note: lower laser powers can be used for this step if sample bleaching is observed. The Z-lock button is activated when it reads “Stop Z-Lock”.
- Once the Z-lock is engaged, fine adjustments can be made by adjusting the Z-offset position. In this case, we want the basal side of the nucleus (i.e. the side closest to the imaging surface) to be in sharp focus.
Setting the illumination angle
- Start by setting the illumination angle at 45° and slowly increase half a degree at a time. Adjust the illumination angle such that the focal plane including the basal side of the nucleus is bright but that the out-of-focus background is reduced. This is typically between 50° and 55°, depending on the Nanoimager system.
Tip! The optimal illumination angle for imaging nuclear pores is slightly less stringent than the maximum at which the sample is still visible. An effective way to determine this optimum is to increase the angle to the point at which illumination of the sample is no longer visible and then reduce this by ~3°. This is 2° less than the highest contrast image, and will result in some background blur around the outside of the nucleus. If poor blinking is seen with the imaging settings described below, this may be caused by too stringent an illumination angle, and so further reducing the angle may be beneficial.
Setting the laser power, frame rate and frame numbers
- Increase the 640 nm laser power until good blinking is achieved. This is typically between 100-150 mW (typically around 50% power for most systems). Deactivate the 640 nm laser.
Note: It is recommended to move to another field of view, as the original field will have partially photobleached through exposure to high laser power. The laser power determined in this step is applicable to all fields of view and does not need to be re-established.
- In Acquisition control, set the exposure time to 30 ms and number of frames to 20,000.
- Enter the folder and filenames into their respective fields (on previous versions of NimOS these are labeled data and acquisition tags).
Practice Acquisition
- Activate the 640 nm laser at low power to find a new cell, focus on the bottom of the nucleus using the Z-offset. When ready, turn the laser power back up to imaging power (e.g. from 5 to 50%) and quickly click ‘Acquire’ to begin acquisition. We recommend using an initial practice acquisition to optimize the illumination angle and Z-offset to obtain the best blinking.
- Adjust the illumination angle up and down until your dSTORM spots have a good signal-to-noise ratio with fast and dense blinking.
Note: If the illumination angle is set too high, the blinking slows down. In this case, it is recommended to lower the illumination angle by 2° to increase blinking speed.
- During acquisition, it is possible to switch to the ‘Analyze’ tab to see the super-resolution image building up in real-time.
Note: During the initial acquisition localizations may form in lines, this is due to thermal drift. This is caused by the temperature either in the sample or the Nanoimager and can be corrected during data analysis.
Full acquisition
- Reactivate the 640 nm laser to the lower laser power, aim to find a big and round nucleus, adjust the Z-offset and illumination if needed to obtain maximum brightness at the bottom of the nucleus.
- To save a diffraction-limited or ‘normal’ resolution image, set the exposure time to 100 ms and number of frames to 1, change the filename and click ‘Acquire’.
- To obtain the dSTORM image, change the filename name, and adjust the exposure time to 30 ms and the number of frames to 20,000.
- Ensure the 640 nm laser is back at the imaging power (around 150 mW), turn on the laser , and click ‘Acquire’.
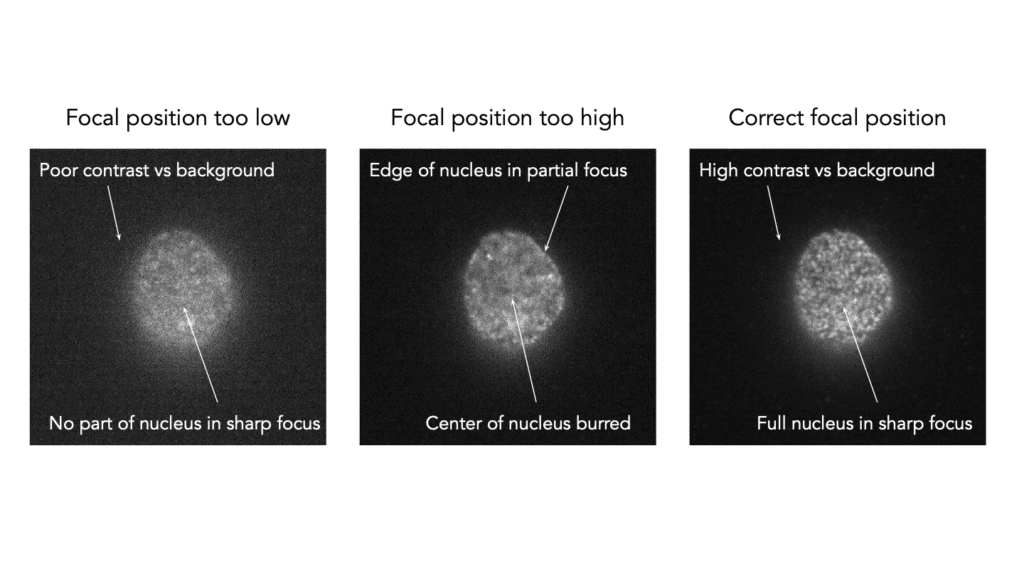
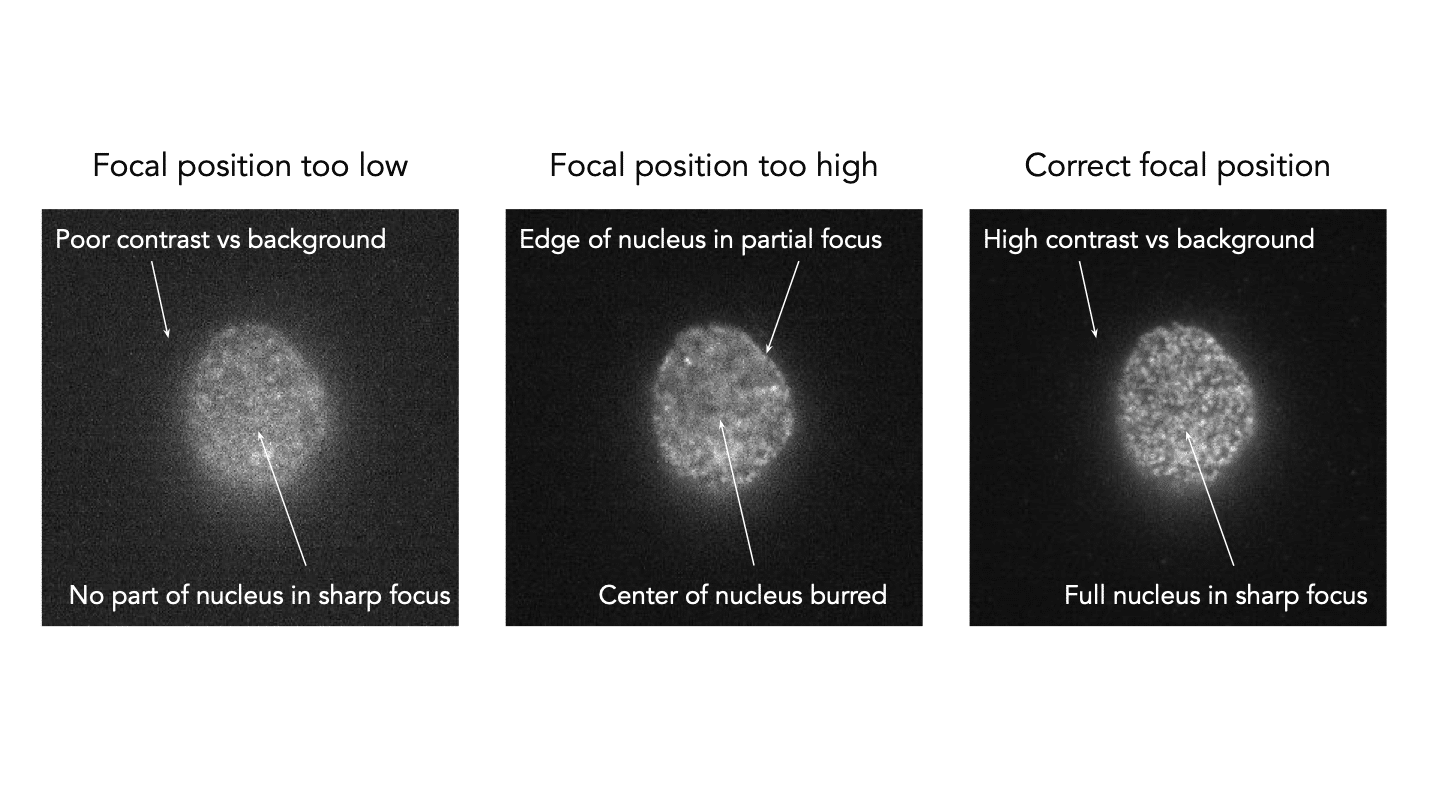
Image Analysis – total time: 5 – 10 min per dataset
CODI is ONI’s cloud-based data analysis program, which is operated in your web browser. It can be accessed through: alto.codi.bio
You can sign up either with your email or a Google account. You will upload your final dSTORM dataset using the CODI Desktop Uploader, then, use pre-configured settings to apply drift correction and basic single-molecule filters, and finally perform localization clustering.
- Sign into CODI, click upload dataset and install the CODI Desktop Uploader if not yet installed. Otherwise, the Upload function in CODI can be used.
- Go to Collaborations, the space where you can organize datasets and share them with other users. Click the new Collaboration button and name it ‘dSTORM Training Kit’.
- Log into the CODI Desktop Uploader, open the file explorer, select the folder containing your data, and select the Nuclear Pore dSTORM Image. Then select the dSTORM Training Kit Collaboration. Click Upload and then the red Upload button without checking the include raw data box. This will upload all files for any given acquisition, with exception of the .tif file.
- Once the data is optimized, you can access your dataset on the cloud from the browser on any computer. Go to CODI in your browser and open Collaborations. Open the relevant dataset by clicking on the thumbnail.
- Click ‘Add a new analysis tab’ on the left-hand side menu, select the ‘Clustering’ App and load the default ‘dSTORM training kit’ settings.
- Click the ‘Run all steps’ play button at the bottom to start the analysis. This includes drift correction, basic single-molecule filters and clustering analysis with parameters optimized in-house by the ONI team.
- Icons on the left will turn green as each tool is applied. Once all the settings have finished running, you can zoom into your image, inspect individual nuclear pores, and you should even be able to resolve the ring-like structure of the nuclear pores.
- To see the improvements after analysis, you can toggle the drift correction button on/off, and, under the filtering tab, see the settings that allow you to exclude localizations based on five different parameters. These settings have been optimized for the dSTORM Training Kit. For more information about localization filtering and the individual filters, please see the CODI How to Guide.
- Go to the Clustering tool tab. Clustering is a method to group together localizations that are near to each other to identify biological structures for further analysis. There are several different algorithms that can be used for clustering, which you can learn about in the CODI How To Guide, or by visiting our website Learning section at oni.bio. For nuclear pores, we are using DBSCAN.
- Each nuclear pore has been grouped as an individual cluster. We can analyze several different features and view them as a histogram for all the pores in the field of view. For example, you can see the cluster area, the number of localizations in each cluster, or the radius of the cluster. For more information on each of these measurements, please refer to the How To Guide or visit the website Learning section.
- Finally, it is recommended to compare the image of the same cells that you acquired with normal (diffraction-limited) resolution. You can full screen the CODI image with the button in the bottom left of the window. Open the TIFF file for the normal resolution image, for instance, using FIJI or Image J.
- In the image with normal resolution, you cannot resolve individual nuclear pores from each other, whereas in the dSTORM image you can resolve pores from each other as well as see the ring-like shape of the pores, even though this is less than 100 nm across. Amazingly, the nuclear pore is about the same size as a single pixel when you look at it with normal resolution.
Troubleshooting notes
Print Section
- Good blinking is essential for the resolution of individual nuclear pores and their structures. Good blinking is characterized by rapid flashing of individual bright spots that are roughly uniform in size and intensity, and that completely disappear to background levels between blinks. It should not be possible to discern any meaningful cellular structures by eye during blinking. Note that it typically takes 100-300 frames for all fluorophores to begin blinking effectively, and so during this time individual spots may not be visible. These frames should be filtered out of the final data.
- Poor blinking is characterized by spots that persist for several seconds, spots that are clearly heterogeneous in size and/or intensity, or being able to still discern cellular structures by eye during blinking.
- The most likely causes of poor blinking are an illumination angle that is too high and/or a laser power that is too low. Troubleshoot this by systematically reducing illumination angle and increasing laser power and observe if blinking improves. If poor blinking is observed even at laser powers >200 mW and illumination angles >10° below the point at which sample illumination is lost, then incorrect illumination settings are likely not the cause of poor blinking. In such a case, try preparing fresh BCubed imaging buffer by mixing both components again. Otherwise, poor quality imaging buffer is the most likely cause so please contact us via: https://oni.bio/contact
- Good photostability is also needed to resolve nuclear pore structures effectively. If the sample exhibits good photostability the overall density of blinks should not obviously decrease by eye in a short period, however will gradually drop over the course of the acquisition. Poor photostability is characterized by a rapid drop in the number of blinking events within 2000-5000 frames. Poor photostability is most likely due to high levels of oxygen within the sample, which indicates either poor imaging buffer quality, or incorrect handling of the buffer during preparation (reminder – take care not to introduce excess oxygen into the solution). Replace the imaging buffer with a fresh stock and repeat imaging. If the imaging buffer is good but poor photostability is still observed, ensure that the laser power is not too high. Reassess the laser power to determine if there is a lower power that still gives effective blinking but induces less photobleaching.
- 20,000 frames is the recommended acquisition length to get excellent nuclear pore morphology, however pores should be visibly evident after 3,000-5,000 frames. If pores are not visibly evident after 10,000 frames it is likely that blinking and/or staining is poor. Acquisitions can be extended beyond 20,000 frames if more localizations are desired, though typically this will not significantly improve visible pore morphology.
Note: if there is drift during acquisition pores may not be clear by eye until post-processing drift correction is performed and is not inherently an indicator of poor blinking.
- If either the signal background on the imaging surface or between nuclear pore complexes is high, this is most likely due to poor washing following staining. Ensure that the full wash volume is flushed through at each step; that liquid is not transferred from the lane inlet to the tube containing PBS; and that the 30 s wait period is observed after each wash step.
Print User Guide