Upcoming Webinar – Small dyes, big impact: Enabling gentle super-resolution imaging in live cells register now>
LNP sample characterization
You provide LNP samples, we produce particle insights

LNP sample characterization service
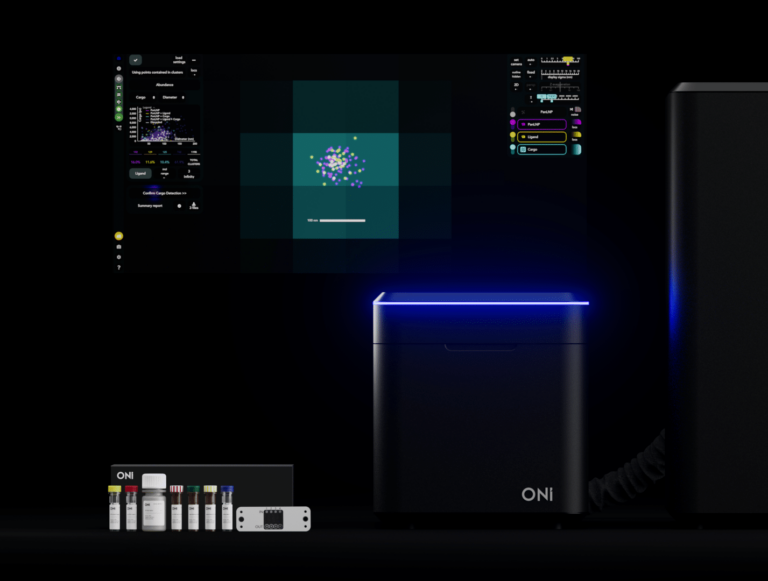
Our in-house team of experts will use ONI’s Aplo Scope super-resolution microscope and the LNP Profiler kit with AutoLNP software to characterize your LNP samples, obtaining insights into LNP formulation heterogeneity and particle profile with single molecule sensitivity.
Our end-to-end solution streamlines LNP analysis from sample prep to imaging, visualization, and reporting, delivering high-resolution (down to 20 nm) data with quantified results, including particle size, cargo loading, ligand positivity (SD < 5%), stability, and aggregation (PDI). Samples are run in triplicate with fast turnaround, cost-effective “Go/No-Go” QC steps, and comprehensive reports for confident decision-making.
Service tiers
Small Batch
5-10 samples
Ideal for proof-of-concept studies, small batch testing, LNP characterization with LNP Profiler workflow. Turnaround time: 1-2 weeks
Scale-up
11-100 samples
Ideal for method optimization, formulation comparison, characterization with LNP Profiler workflow. Turnaround time: 2-3 weeks
Tailored
100+ samples
Ideal for non-standard particle formulations, cell-based analysis, QC, or high-throughput screening.
Turnaround time: tbd
Interested in a quote?
What you’ll receive
Kickoff meeting
Critical data related to experiment design is gathered, and anticipated data outputs are agreed to meet specific requirements.
Data review meeting
Scheduled after experiments conclude, which include an in-depth experiment results review with an ONI Applications Scientists.
Summary report
A complete summary report as well as access to raw data will be provided through our web-based CODI platform for further investigation using ONI workflows and apps.
- Evaluation of sample integrity, stability, or fragmentation
- Super-resolution sizing with nanometer precision using machine-learning algorithms
- Comprehensive LNP characterization report including overall LNP size distribution and per lane polydispersity index (PDI)
- Per-particle payload, including encapsulation and ligand ratios
- CODI image access and analysis pipeline
- Particle distribution analysis, cross dataset comparison and trend analysis
- Statistical analysis
- User access to CODI for personalized analysis
The ONI advantage

Size & morphology
Optimize LNP formulations with super-resolution analysis from whole populations down to single particles. Visualize LNPs with nanometer precision for a quick evaluation of sample integrity, stability, aggregation or fragmentation.
Unlike techniques like flow cytometry and mass-spectrometry, which aggregate data, SMLM methods like dSTORM provide precise nanometer-level details on LNP morphology and size: small particles may indicate degradation, large ones can be aggregates, and high polydispersity suggests instability. With the full information and structural anomalies, scientists can accurately assess their LNP behaviour and optimize the formulation for effective therapeutic applications.

Assess cargo encapsulation
ONI’s LNP characterization service enables precise assessment of cargo encapsulation at the single-particle level. Using a combination of diffraction-limited imaging for nucleic acid staining and super-resolution imaging of PanLNP and ligand markers, scientists can visualize LNP populations with nanometer precision.
By integrating SMLM imaging of PanLNP surface markers, fluorescence imaging of cargo, and the advanced analysis capabilities of AutoLNP, the service provides detailed insights into cargo positivity per LNP. This allows determination of cargo-loaded fraction and cargo distribution with a standard deviation of less than 5% across samples. These high-resolution measurements provide an accurate picture of loading efficiency, revealing heterogeneity and structural variations that conventional bulk methods might miss, enabling confident optimization of LNP formulations for therapeutic applications.

Quantify ligand loading
A major challenge in LNP therapeutic development is ensuring that cargo is effectively encapsulated in as many particles as possible. Accurately assessing cargo distribution across LNP populations is essential for optimizing formulations.
ONI’s LNP characterization service combines super-resolution imaging of LNP surface markers, fluorescence imaging of cargo, and advanced analysis tools to quantify cargo positivity at the single-particle level. This high-resolution approach provides precise measurements of loading efficiency without the inaccuracies of signal averaging. Researchers gain detailed insights into both the fraction of cargo-positive LNPs and the abundance per particle, with a standard deviation of less than 5% across samples. These data reveal not only individual particle behavior but also population-level trends, enabling confident optimization of LNP formulations for therapeutic applications.
Figure (left): Size distribution of 3 LNP populations: Top row – empty LNP, middle row – cargo-containing LNP, bottom row – 1:1 mix of empty LNPs and cargo-containing LNPs. Surface marker is in magenta, RNA cargo is in cyan (diffraction-limited images).
Correlate LNP metrics
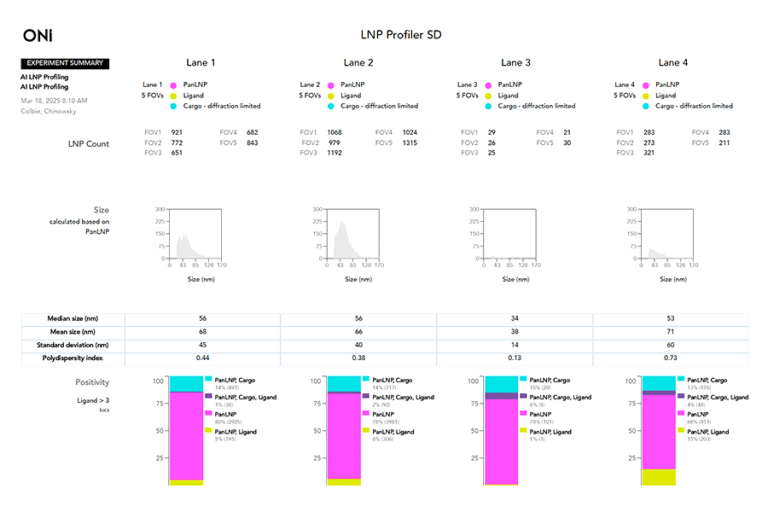
ONI’s LNP characterization service provides comprehensive analysis of LNP populations, delivering actionable data to guide faster, more informed decisions. The service correlates multiple metrics, including the fraction of cargo-positive LNPs, surface ligand abundance, cargo levels per lane (measured in photon counts from diffraction-limited imaging), and ligand abundance per particle (number of localizations per LNP). It also evaluates LNP size distribution as a function of both cargo loading and positivity.
By analyzing the morphology and size of individual LNPs, scientists gain insights into particle uptake and delivery efficiency, based on both ligand abundance and cargo positivity. This high-resolution, multiparametric data enables precise optimization of LNP formulations for therapeutic applications.
Figure (left): LNP sample stained with LNP Profiler service. Imaged using AutoLNP and Nanoimager, analyzed by CODI. PanLNP (magenta) was used to calculate size, ligand (yellow) to measure engineering, and diffraction-limited RNA stain (cyan) to evaluate cargo encapsulation.


FAQs
What types of information can I expect from the LNP characterization service?
You’ll receive a detailed report with quantified results, including particle size, cargo loading efficiency, ligand positivity (SD < 5%), stability, and aggregation (PDI). Data are generated with single-molecule sensitivity and super-resolution imaging down to 20 nm.
How quickly will I receive my results?
Turnaround time depends on the service tier:
-
Small Batch (5–9 samples): 1–2 weeks
-
Scale-up (10+ samples): 2–3 weeks
-
Tailored (10+ samples, custom needs): Turnaround time discussed case-by-case.
How are samples analyzed to ensure reliability?
All samples are run in triplicate to improve statistical confidence. Automated image acquisition and quantification with ONI’s super resolution platform and AutoLNP software help eliminate user bias, ensuring reproducible and robust results.
Is the service suitable for early-stage or large-scale studies?
Yes. The service is designed to support both early-stage, proof-of-concept testing (Small Batch) and larger-scale projects such as formulation optimization, QC, and high-throughput screening (Scale-up and Tailored). This flexibility allows you to generate actionable insights at any stage of your development workflow.